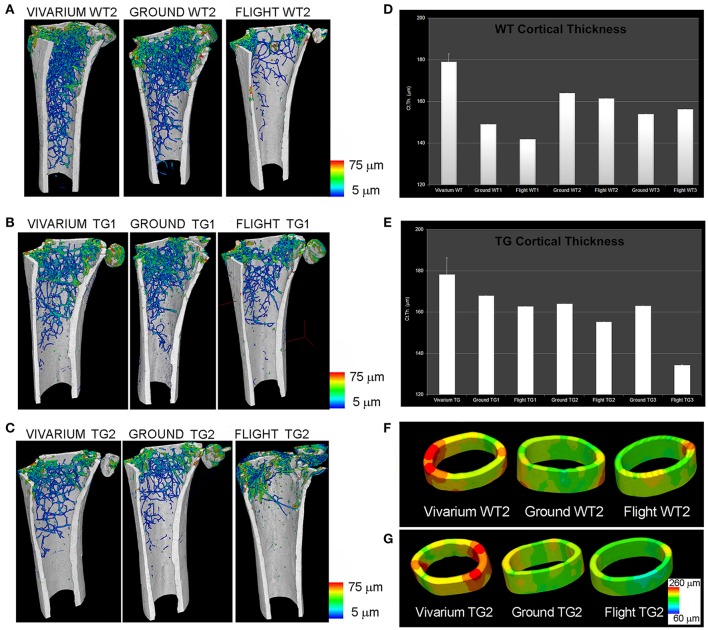
Figure 1.
MDS spaceflight mission. Femurs of mice housed for 3 months in the International Space Station (ISS). (A–C) Wt2 (A), PTN-Tg1 (B), PTN-Tg2 (C) color map of trabecular thickness distribution of vivarium (representative sample), ground and flight mice. (D,E) Quantification of cortical thickness distribution in Wt (D) and PTN-Tg (E) vivarium control (average on 3 mice), ground and flight mice. (F,G) Cortical thickness color maps of representative 3D reconstructions in Wt2 vivarium, ground and flight (F) and in PTN-Tg2 vivarium, ground, and flight (G). (A–C) were originally published in Figure 1 of (Tavella et al., 2012). (D–G) were originally published in Figure 3 of (Tavella et al., 2012).

