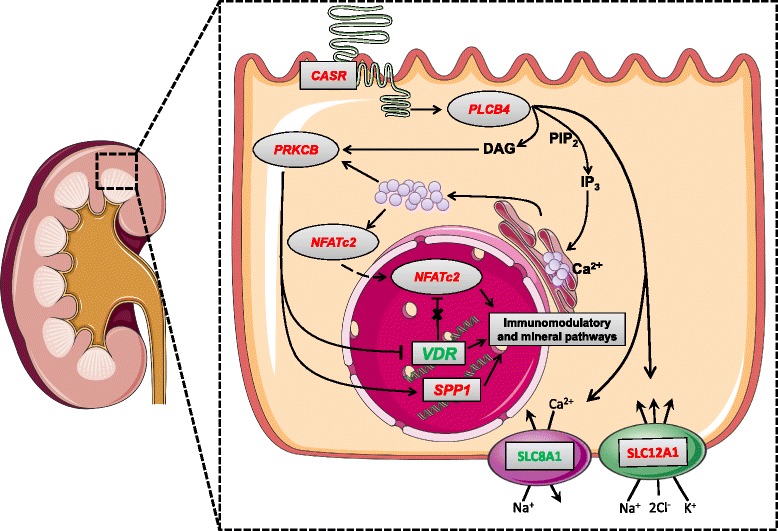
Fig. 1.

Model for signal transduction in renal cells due to lowered P intake. Solid arrows represent activation, dashed arrows represent inhibition. The data is based on a microarray comparison between groups L and M. Genes in red: L > M; genes in green: L < M. L – Low P supply; M – Medium P supply; H – High P supply
