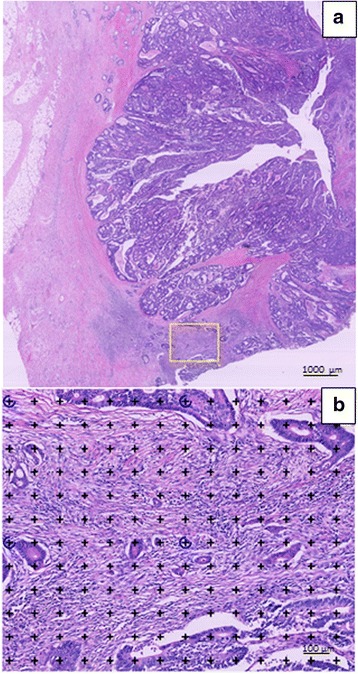
Fig. 1.

Stereological estimation of tumour stroma ratio. a The area with the highest stroma density (yellow frame) is subjectively selected at low magnification (2×). b At higher magnification (10×) a grid of 4 x (6 × 7) points is superimposed on the selected area. Points hitting either tumour cells or stroma are counted separately. Tumour cells must to be present at all borders of the visual field (north-east-south-west)
