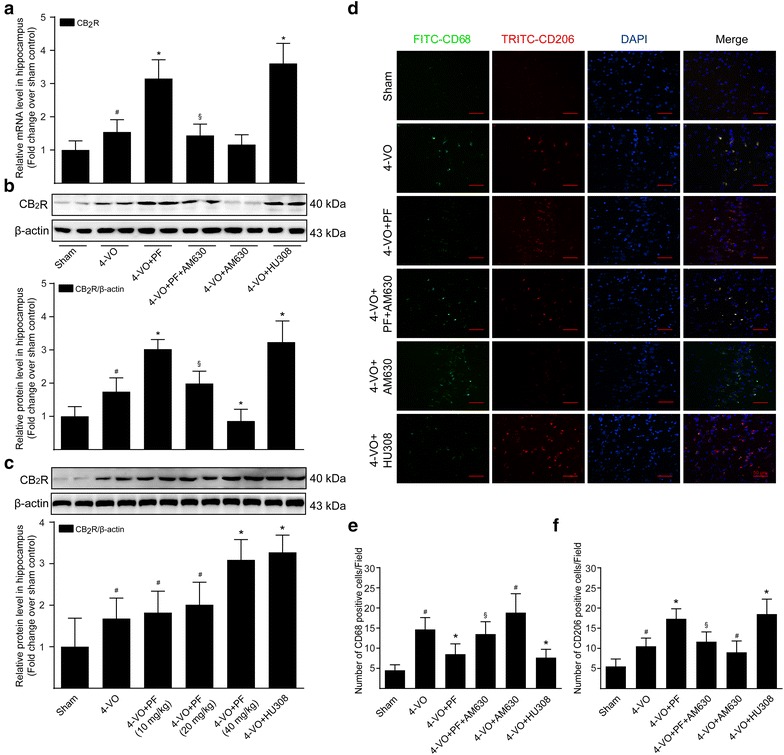
Fig. 2.

Effects of paeoniflorin on the expression of CB2R and M1/M2 polarization markers in microglia/macrophage in hippocampi of rats after cerebral ischemia. After 28 days consecutive drug treatment, a real-time quantitative PCR analysis of the mRNA level of CB2R in the hippocampus tissues of rats from different groups: sham (sham operated), 4-VO (four-vessel occlusion operated), 4-VO+PF (four-vessel occlusion operated plus paeoniflorin 40 mg/kg/day), 4-VO+PF+AM630 (four-vessel occlusion operated plus paeoniflorin 40 mg/kg/day and AM630 3 mg/kg/day), 4-VO+AM630 (four-vessel occlusion operated plus AM630 3 mg/kg/day) or 4-VO+HU308 (four-vessel occlusion operated plus HU308 3 mg/kg/day). b Proteins were extracted from hippocampi of rats and subjected to Western blotting analysis using primary antibody specific for CB2R. Blots were stripped and re-probed with antibody against β-actin to correct for differences in protein loading. Fold-change in the relative level of CB2R protein is shown after normalizing with β-actin. c CB2R protein level in hippocampi of rats was analyzed by Western blotting from different groups: sham (sham operated), 4-VO (four-vessel occlusion operated), 4-VO+PF (four-vessel occlusion operated plus paeoniflorin 10, 20, 40 mg/kg/day) or 4-VO+HU308 (four-vessel occlusion operated plus HU308 3 mg/kg/day). d Hippocampus tissue sections were co-stained for CD68 (M1 marker; green) or CD206 (M2 marker; red) and DAPI (blue). The images were observed and captured by a confocal laser scanning microscope. Scale bar: 50 μm. e, f Quantitative analysis of the number of CD68-positive and CD206-positive cells per visual field in the hippocampal CA1 region of rats. Each bar represents mean ± SD of three independent experiments. n = 6 rats per group. #P < 0.05 versus sham group, *P < 0.05 versus 4-VO model group, §P < 0.05 versus 4-VO+PF group
