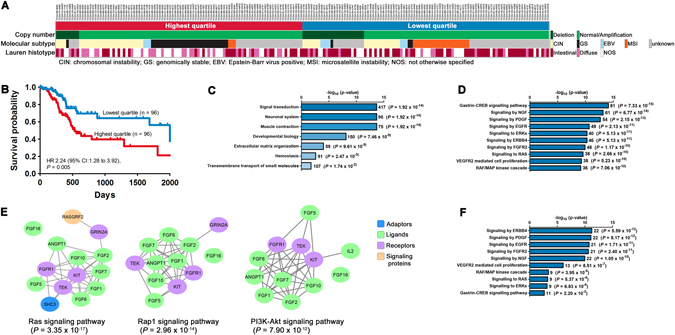
Fig. 2.

Clinicopathological correlations of gastric cancers with DOK6 expression. a Association of the highest and lowest quartiles of DOK6-expressing gastric cancers with FRA18C copy number status, Lauren histotype and molecular subtype. Columns represent individual gastric cancer tumors of the respective quartiles. b Kaplan–Meier survival plot showing longer survival of patients in the lowest quartile. Data for (a) and (b) are from the TCGA STAD study. c Processes mapped by Reactome for genes underexpressed in the lowest compared to the highest quartile. d Top 10 canonical pathways represented by 417 genes of the signal transduction process in (c). e Signaling pathways enriched in 34 core genes present in all 10 pathways in (d) by STRING analysis. f Signaling pathways enriched in differentially expressed proteins (RPPA data). The number of genes and FDR-corrected P-values are shown for each bar in (c, d and f)
