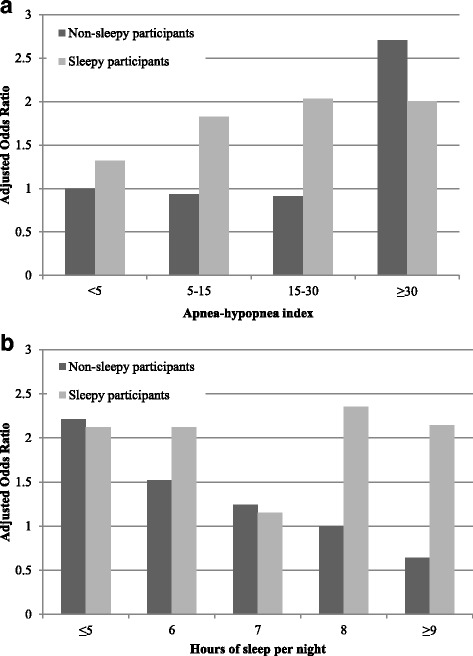
Fig. 2.

The relation of sleep apnea (a) and reported usual sleep duration (b) to motor vehicle crash risk, adjusted for age, sex, and miles driven. Data are shown separately for non-sleepy (black, n = 2402) and sleepy (gray, n = 799) participants, where sleepiness is defined as a score ≥ 11 on the Epworth Sleepiness Scale. The referent group for a is non-sleepy participants with apnea-hypopnea index < 5. The referent group for b is non-sleepy participants reporting a usual sleep duration of 8 hours per night
