
Figure 1.
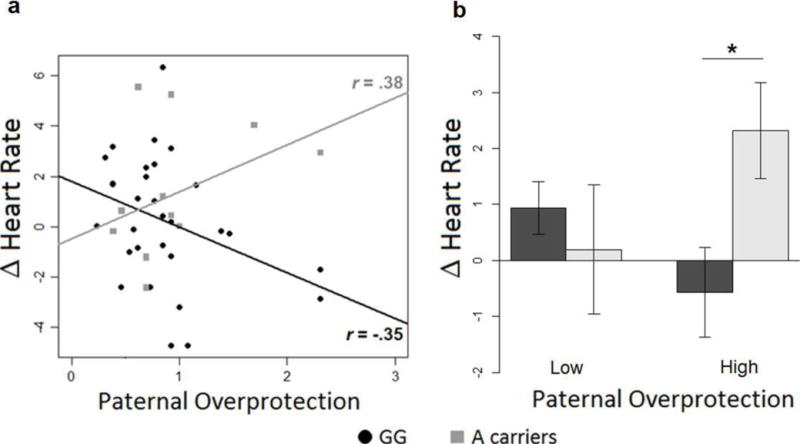
a–b. Effect of the interaction between paternal overprotection and genotype on HR changes. a) Correlations between Heart Rate responses to distress vocalizations (calculated as difference from baseline) and experienced paternal overprotection. Black circles = G/G homozygous; grey squares = A carriers. Lines represent the linear models for G/G homozygous (black) and A carriers (grey). In the figure the r-values represent Pearson’s r correlations. b) Comparison between HR mean changes from baseline in G/G homozygotes (black) and A carriers (gray) divided in high and low paternal overprotection.