
Figure 1. Cell proliferation and quiescence in prostate epithelium and stroma.
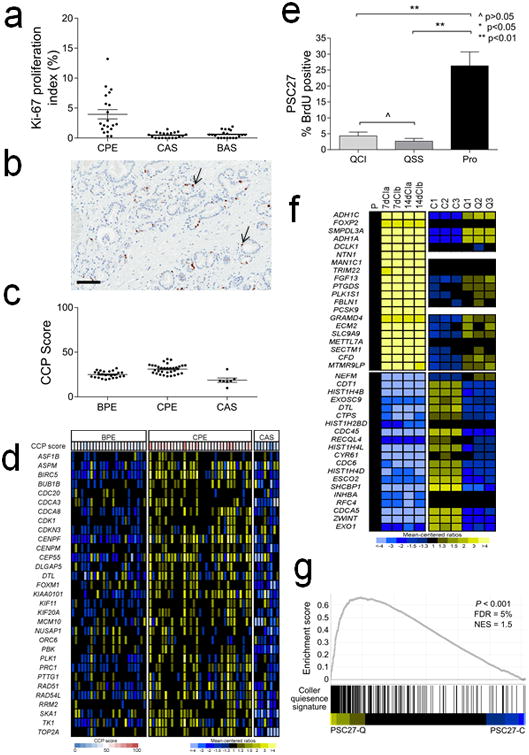
a. Ki-67 immunohistochemistry of prostate carcinoma cells (CPE), cancer adjacent stromal cells (CAS) and stromal cells adjacent to benign glands (BAS). The mean (±SEM) Ki67-index (%) for CPE, CAS and BAS was 4.0 ± 0.8% (±SEM), 0.5 ± 0.1% and 0.6 ± 0.1%, respectively. The differences were statistically different by Student's t test for CPE vs. CAS and CPE vs. BAS.
b. Image of Ki-67 immunohistochemistry. Brown chromogenic nuclear staining denotes a Ki-67 positive cell (arrow). Black line = 100 μM.
c. Cell cycle proliferation (CCP) score calculated from microarray-based quantitation of gene expession from microdissected benign prostate epithelium (BPE), prostate carcinoma (CPE) and cancer adjacent stroma (CAS).
d. Heatmap of genes comprising the cell cycle progression (CCP) score. Rows represent CCP genes and columns are tissue samples from different patients.
e. Quantitation of bromodeoxyuridine (BrdU) values from PSC27 fibroblasts proliferating (Pro) or growth arrested by contact inhibition (QCI) or serum starvation (QSS).
f. Heatmap of gene epression comparing a gene set previously shown to associate with cellular quiescence (left panels) with PSC27 prostate fibroblast quiescence (right panels). P, proliferating cells; 7dCI, cells 7 days after contact growth inhibition; 14dCI, cells 14 days after contact growth inhibition (from Lemons et al (26)). C1,C2,C3, biological replicates of proliferating PSC27 prostate fibroblasts; Q1,Q2, Q3, biological replicates of quiescent PSC27 prostate fibroblasts.
g. Gene set enrichment analysis comparing quiescent PSC27 prostate fibroblast gene expression with the quiescent fibroblast gene expression profile as determined by Lemons et al. (26).