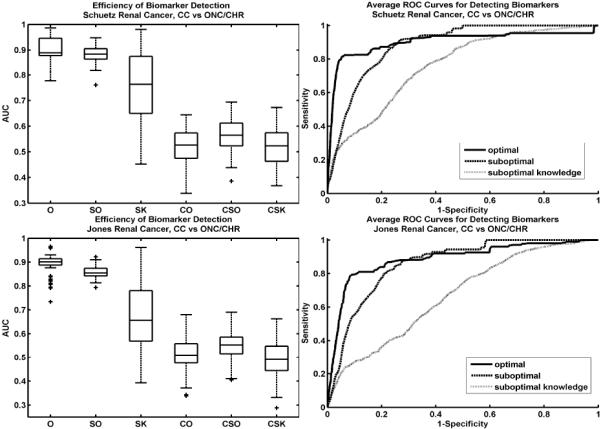
Figure 2.

Box plots of AUC areas over 100 iterations for each test (left). AUCs for the optimal test (O) are higher than both the sub-optimal (SO) and sub-optimal knowledge (SK) tests (differences are statistically significant with p-values very close to 0). The control tests, using randomly selected knowledge indicate that optimizing the ranking metric does not over-fit (CO=control optimal, CSO=control suboptimal, CSK=control suboptimal knowledge). Average ROC curves for each test, illustrate the differences in biomarker detection efficiency (right). The ROC for the optimal metric test (solid line) indicates more accurate biomarker detection for both the Schuetz (top row) and Jones (bottom row) renal cancer datasets.
