Fig. 4.

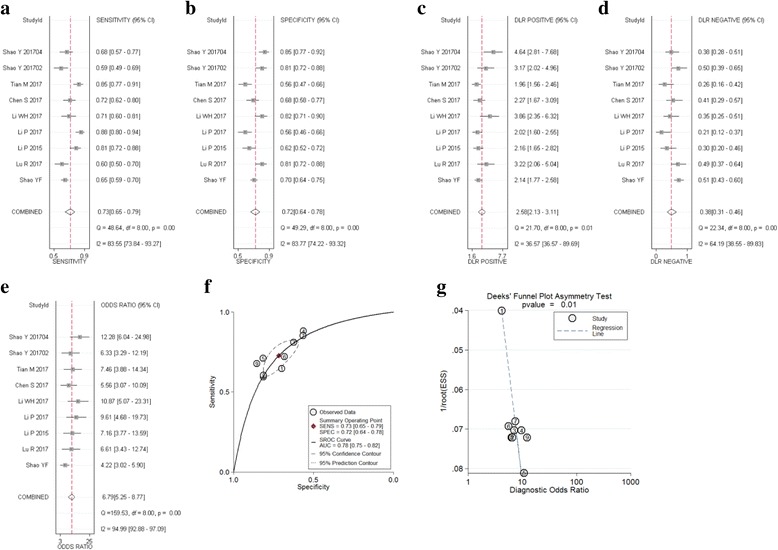
Forest plots of sensitivity, specificity, PLR, NLR, DOR, AUC, and funnel plot for diagnosis of circRNA in GC among 9 studies. a Sensitivity; (b) Specificity; (c) PLR; (d) NLR; (e) DOR; (f) AUC; and (g) Funnel plot

Forest plots of sensitivity, specificity, PLR, NLR, DOR, AUC, and funnel plot for diagnosis of circRNA in GC among 9 studies. a Sensitivity; (b) Specificity; (c) PLR; (d) NLR; (e) DOR; (f) AUC; and (g) Funnel plot