
Fig. 3.
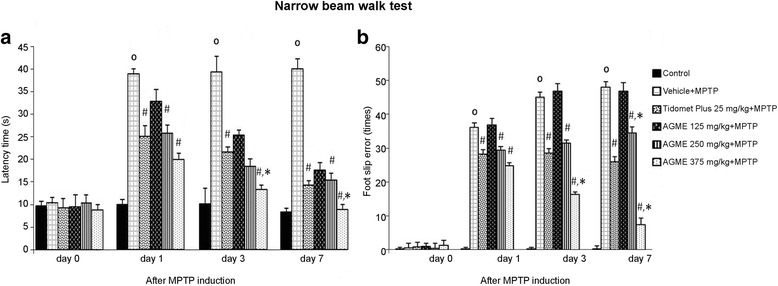
Effect of AGME on latency time (a) and foot slip errors (b) on the narrow beam test at 0, 1, 3, and 7 days after MPTP induction. Each data column represents the mean ± SD (n = 8/group, o-p < 0.01 compared with the control group; #-p < 0.05 compared with the vehicle-treated group; *-p < 0.05 compared with the Tidomet Plus-treated group)