
Fig. 2.
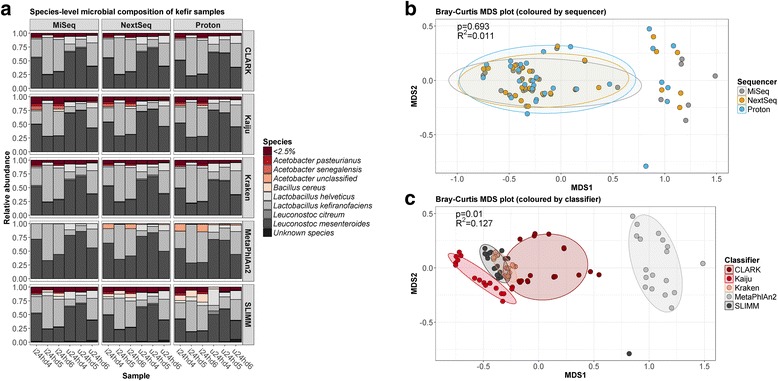
Compositional analysis of kefir samples using the total number of reads from each sequencer. a Species-level profile of the kefir samples, as determined by each species classifier. b Dissimilarity plot showing differences between sequencers. c Dissimilarity plot showing differences between species classifiers