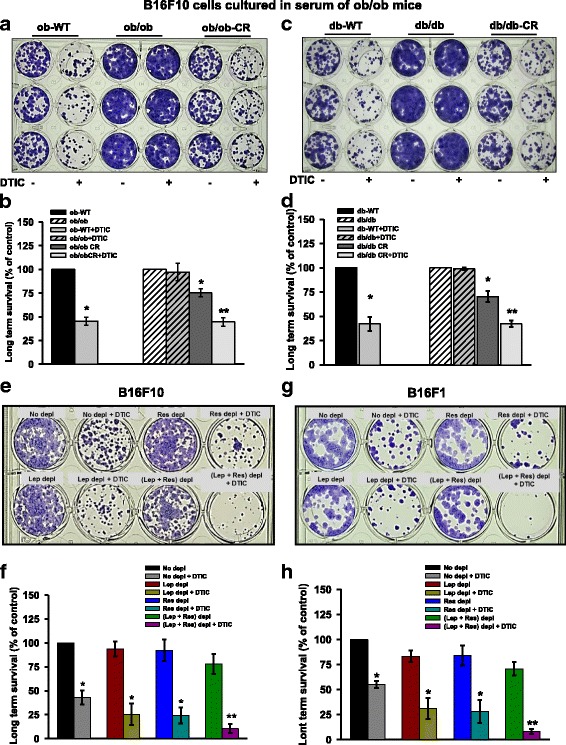
Fig. 2.

Effect of obesity-associated serum factors on the long-term survival of B16F10 and B16F1 cells treated with DTIC. a, b B16F10 cells were chronically grown in the medium containing 5% serum collected from experimental ob/ob mice for 15 days. Thereafter, these cells were subjected to DTIC treatment for 48 h. Then, the medium was changed and fresh medium was added. The medium was changed every 2–3 days. a Representative image showing the long-term survival of B16F10 cells. b Bar graph showing the quantitation of number of surviving population from the image shown in a. c, d Similar experiment was performed in B16F10 cells chronically grown in the serum from db/db mice. After 10 days, the cells were stained with 0.05% crystal violet, and images were taken using Olympus digital camera. e–h B16F10 and B16F1 cells were cultured in serum (collected from C57BL/6J mice) which was immuno-depleted of leptin and or resistin for 48 h. Then, DTIC treatment was given, and cells were incubated for 48 h. Next, the medium was changed and fresh medium was added. e Representative image showing the long-term survival of B16F10 cells. f Bar graph showing the quantitation of number of surviving population from the image shown in e. g Representative image showing the long-term survival of B16F1 cells. h Bar graph showing the quantitation of number of surviving population from g. The data are representative of experiments performed two times at least in triplicates. The data were quantified using Image J software. The results are given as means ± standard error of the mean. Statistical analysis was performed using one-way ANOVA, followed by the Tukey multiple comparison test (for b and d), whereas two-tailed unpaired Student’s t test was used (for f and g). *p < 0.05, **p < 0.001; Ctrl, control; Lep, leptin; Res resistin
