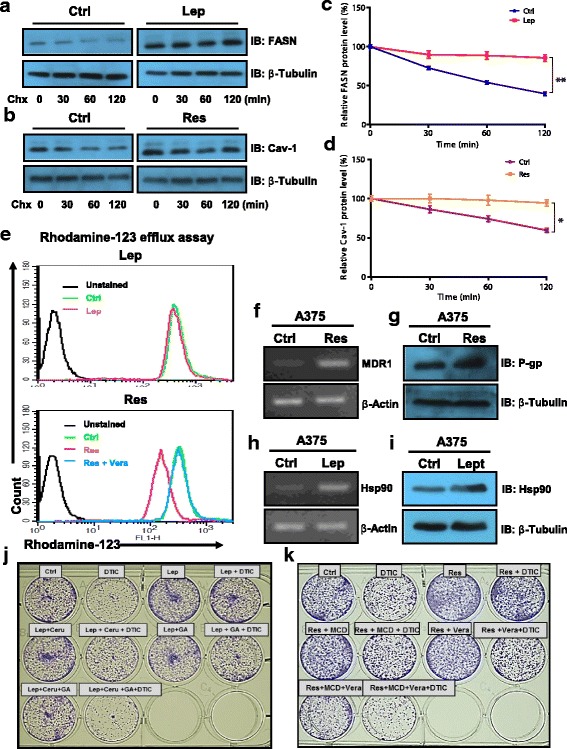
Fig. 3.

Molecular events associated with leptin and resistin induced impaired outcome of DTIC therapy in melanoma cells. a, b A375 cells were treated with leptin or resistin at a concentration of 100 ng/ml in DMEM containing 1% FBS for 48 h as described in the “Materials and methods” section. Thereafter, cycloheximide (100 μg/ml) treatment was given for the indicated time points. Representative immunoblot of FASN (a) and Cav-1 (b) in A375 cells treated with leptin or resistin respectively. c, d Bar graph showing the quantitation of band intensity of FASN and Cav-1 immunoblots. e Rhodamine-123 efflux assay in A375 cells treated with leptin (upper panel) or resistin (lower panel). A375 (human melanoma) cells were plated in 12-well plates. After 24 h, cells were treated with 100 ng/ml of recombinant leptin in DMEM containing 1% FBS for 48 h. Thereafter, these cells were subjected to Rh-123 efflux assay via flow cytometry. f, g RT-PCR (f) and immunoblotting (g) analysis of MDR and P-gp respectively in A375 cells treated with resistin. h, i RT-PCR (h) and immunoblotting (i) analysis of HSP90 in A375 cells treated with leptin. j, k Representative image showing the long-term survival of A375 cells grown in the presence or absence of leptin (j) or resistin (k) together with inhibitors. The results are given as means ± standard error of the mean. All the experiments were performed three times. Statistical analysis was performed using two-tailed unpaired Student’s t test for c and d. *p < 0.05, **p < 0.001; Ctrl, control; Lep, leptin; Res, resistin; Chx, cycloheximide; Ceru or C, cerulenin; GA or G, geldanamycin
