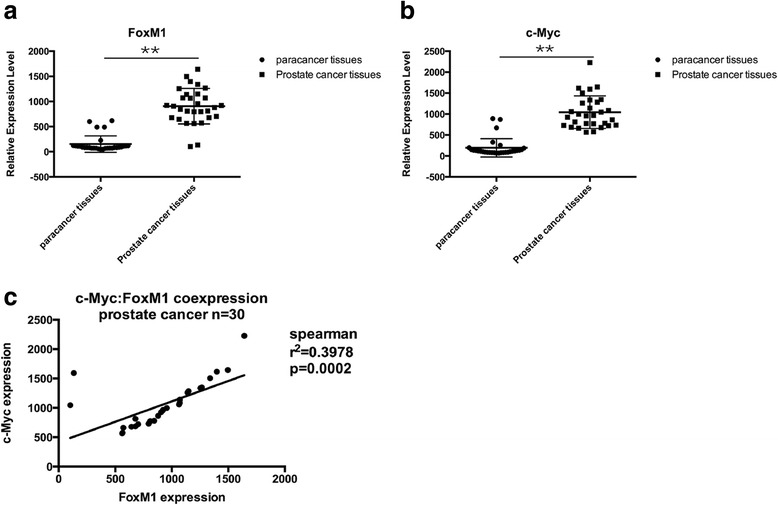
Fig. 1.

The expression level of FoxM1 and c-Myc in prostate cancer tissues and para-cancer tissues. Thirty prostate cancer samples and para-cancer samples were collected and isolated for obtaining RNA. a The expression level of FoxM1 was detected by real-time PCR. b The expression level of c-Myc was detected by real-time PCR. c The correlation analysis of the expression level of FoxM1 and the expression level of c-Myc. (**p < 0.01)
