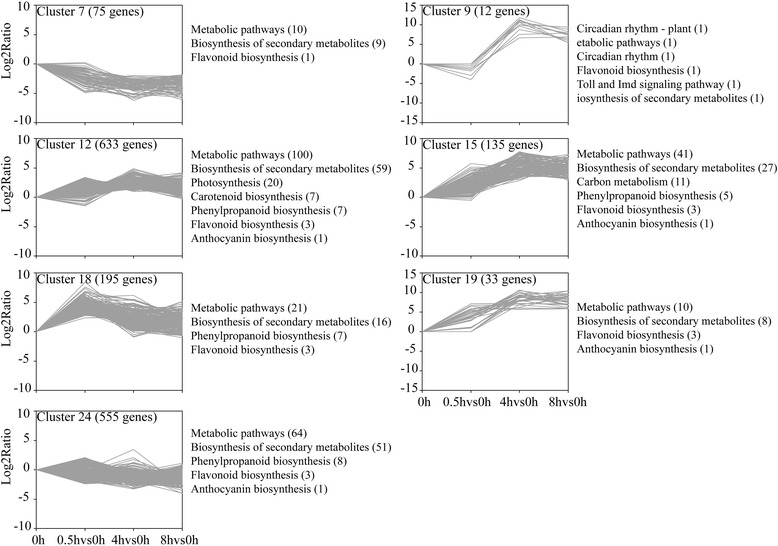
Fig. 5.

Cluster analysis of DEGs with significant expression profile changes and KEGG pathway enrichment analysis. All the DEGs were subjected to complete-linkage hierarchical clustering using a Euclidean distance metric and divided into 26 clusters. The x-axis showed the time point to time point comparison. The y-axis shows the relative log2(ratio) of each comparison. Enriched KEGG pathways are listed to the right of each cluster
