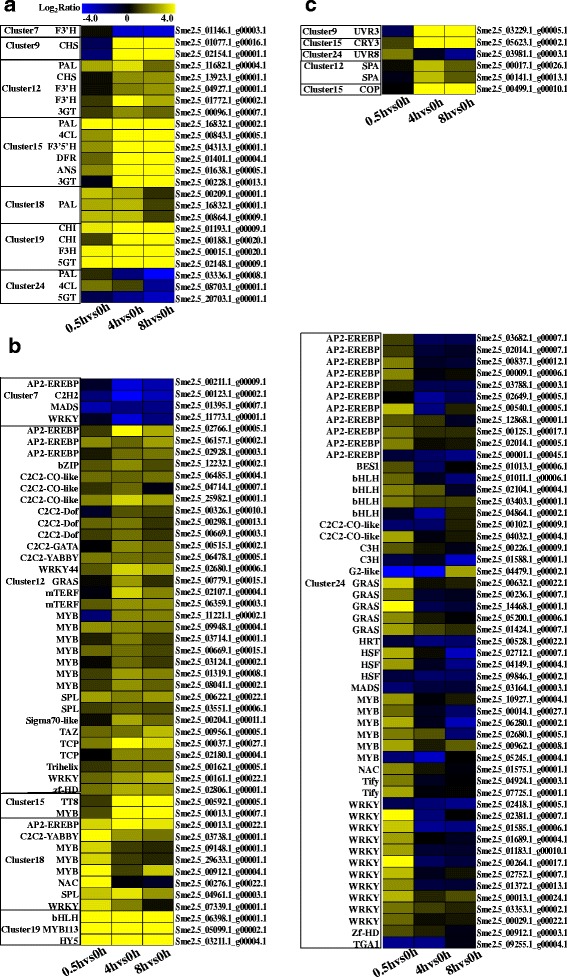
Fig. 6.

Heat map representation of the genes expression patterns. a The structural anthocyanin biosynthesis genes, b All the transcription factors response to light, c The photoreceptors and genes related to light signal transduction. The color scale represents the Log2 (fold-change to the 0 h time point). Genes that are upregulated appear in yellow, and those that are downregulated appear in blue, with the relative Log2Ratio reflected by the intensity of the color
