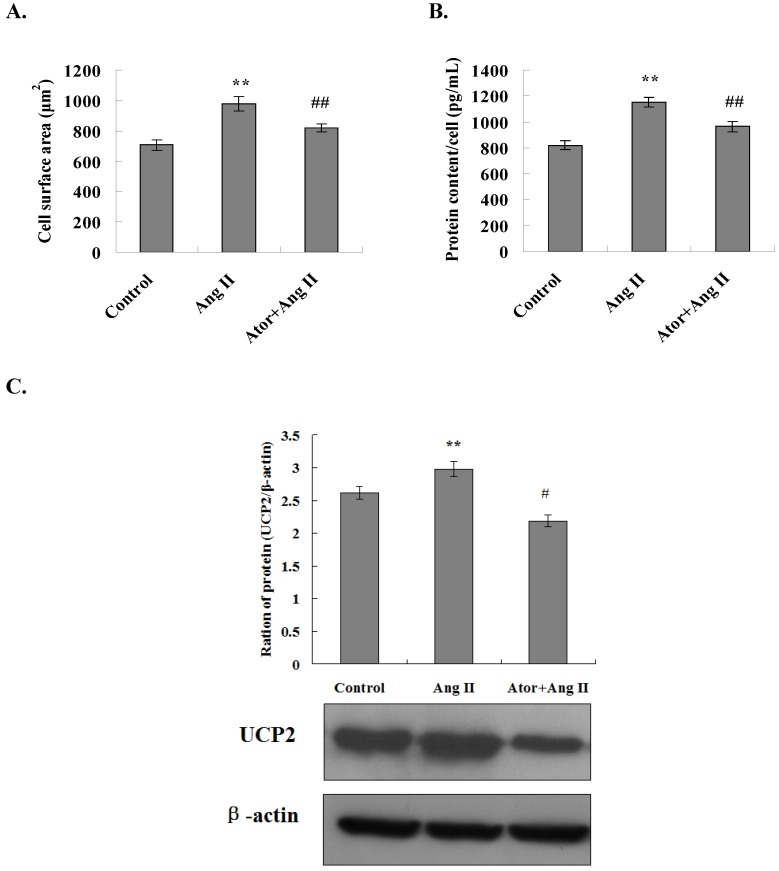
Figure 4.
Atorvastatin inhibited Ang II-induced cardiomyocyte hypertrophy through the downregulation of UCP2 expression. (A) Cell surface area measurement. Inverted phase contrast microscope was used to obtain the cardiomyocyte images at ×100 magnification. The surface area of a minimum of 25 cells per treatment group was measured and averaged to generate one N value. The data are presented as the means ± SD. **P < 0.01 vs. control group, ##P < 0.01 vs. Ang II group. (B) Total protein content per unit of cells. The protein extracts from cardiomyocytes were prepared, and the total protein content per unit cells calculates. The data are presented as the means ± SD. **P < 0.01 vs. control group, ##P < 0.01 vs. Ang II group. (C) Western blotting was performed to determine the UCP2 expression. Proteins were extracted from cardiomyocytes, separated by SDS-PAGE, and immunoblotted sequentially using the anti-UCP2 antibody. The graph shows the result of densitometric quantification of the UCP2 protein relative to β-actin utilized as an internal control. The data are presented as the means ± SD. **P < 0.01 vs. control group; #P < 0.05, ##P 0.01 vs. Ang II group.

