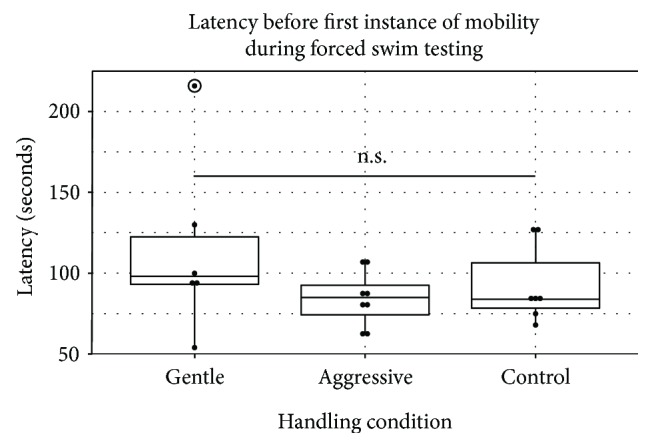
Figure 2.

Latency prior to the first instance of immobility by the handling groups (gentle, aggressive, and control). There were no significant differences reported among conditions, with the gentle group showing the longest latency to immobility (median = 98.00 s), followed by the aggressive group (median = 85.00 s) and the control group (median = 84.00 s). Box plots illustrate the individual data points (solid dots), lower and upper quartiles (upper and lower sides of boxplot), median (dark, middle bar), and lowest and highest values (whiskers). An outlier is circled in the gently handled group.
