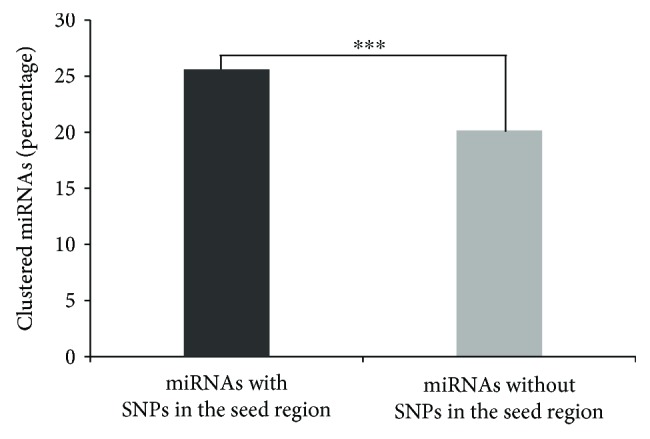
Figure 1.

Clustering patterns of the miRNAs with SNPs in their seed region. Percentage of clustered miRNAs in miRNAs with or without variations in their seed region. miRNAs with SNPs in their seed region were significantly enriched in clusters. The y-axis is the percentage of miRNAs that are located in clusters in that group. ∗∗∗ P < 0.001.
