
Figure 5.
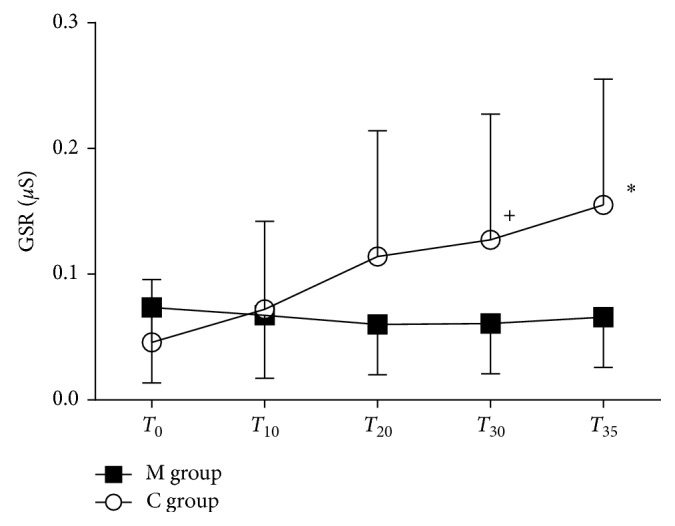
Galvanic skin response. Galvanic skin response (µS) in the music group (M group) and control group (C group) at different time point. Data are presented as mean ± SD. +p=0.031 and ∗p < 0.045.
Official websites use .gov
A
.gov website belongs to an official
government organization in the United States.
Secure .gov websites use HTTPS
A lock (
) or https:// means you've safely
connected to the .gov website. Share sensitive
information only on official, secure websites.
Galvanic skin response. Galvanic skin response (µS) in the music group (M group) and control group (C group) at different time point. Data are presented as mean ± SD. +p=0.031 and ∗p < 0.045.