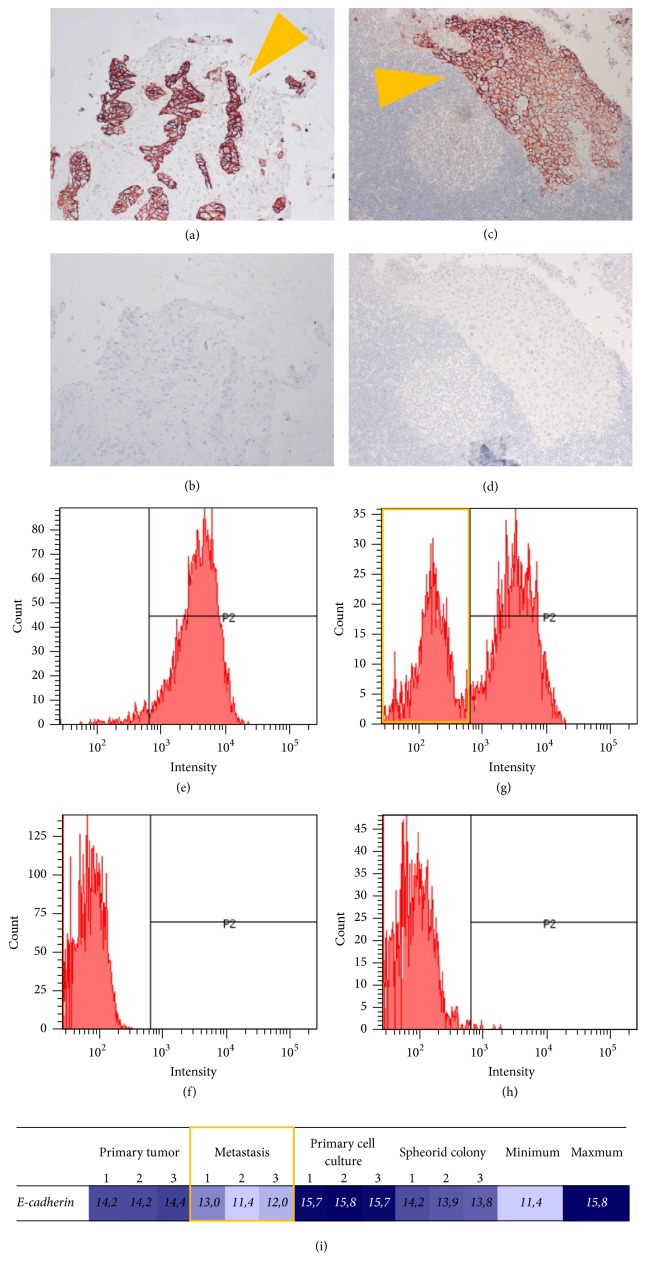
Figure 3.
Expression of E-cadherin as epithelial marker. Immunohistochemistry showed expression of E-cadherin in primary tumor and metastasis (orange arrows): (a-b) primary tumor, 10x magnification; (c-d) metastasis, 20x magnification; (a), (c) haematoxylin and eosin and E-cadherin; (b), (d) negative control. Flow cytometry showed a population with E-cadherin-loss in the spheroid colony (highlighted orange): (e-f) primary cell culture; (g-h) spheroid colony; (e), (g) E-cadherin; (f), (h) negative control. (i) Transcriptome analysis showed the weakest signal for E-cadherin in the metastasis (highlighted orange); columns: phenotypes/samples and minimum/maximum; row: tag.

