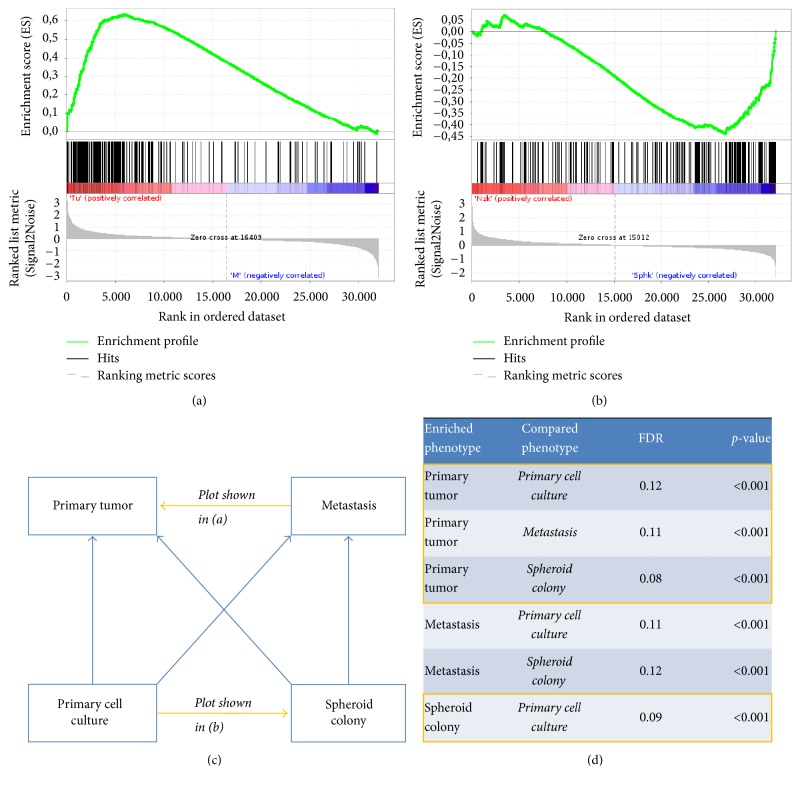
Figure 4.
Gene set enrichment analysis of transcriptome data with a gene set representing epithelial-mesenchymal transition (Hallmark_epithelial_mesenchymal_transition, M5930). (a), (b) Enrichment plots: (a) enrichment of EMT in tumor over metastasis and (b) enrichment of EMT in spheroid colony over primary cell culture. (c), (d) Summary of enrichment results shows consistent enrichment of EMT in the primary tumor against all other phenotypes and enrichment in the spheroid colony against the primary cell culture (highlighted orange); (c) overview of phenotypes with direction of enrichment for EMT gene set in all pairwise comparisons; (d) false discovery rate (FDR) and p values.

