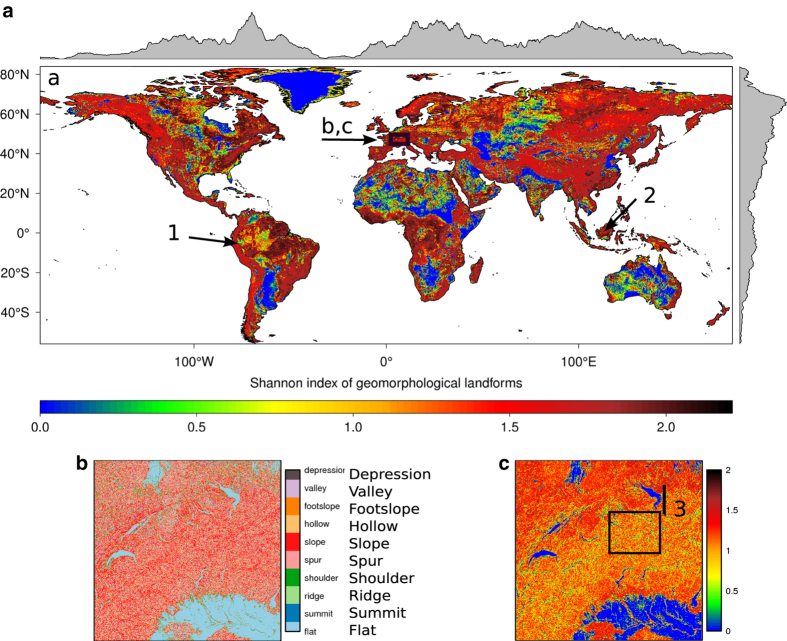
Figure 4. Exemplary map showing the Shannon index of the geomorphological landforms, aggregated to 1 km: a) global view, b) magnification of the 10 underlying geomorphological landforms, c) magnification of the derived Shannon index (the magnification area is part of the Alps and is delineated in plot a).
The box in c) represents the study area in Figure 5, and the line 3) identifies the location of the profile depicted in Figure 6. The arrows 1 (Andes) and 2 (Indonesia) drawn in a) point to the location of topographic variable profiles shown in Supplementary Figs 1.

