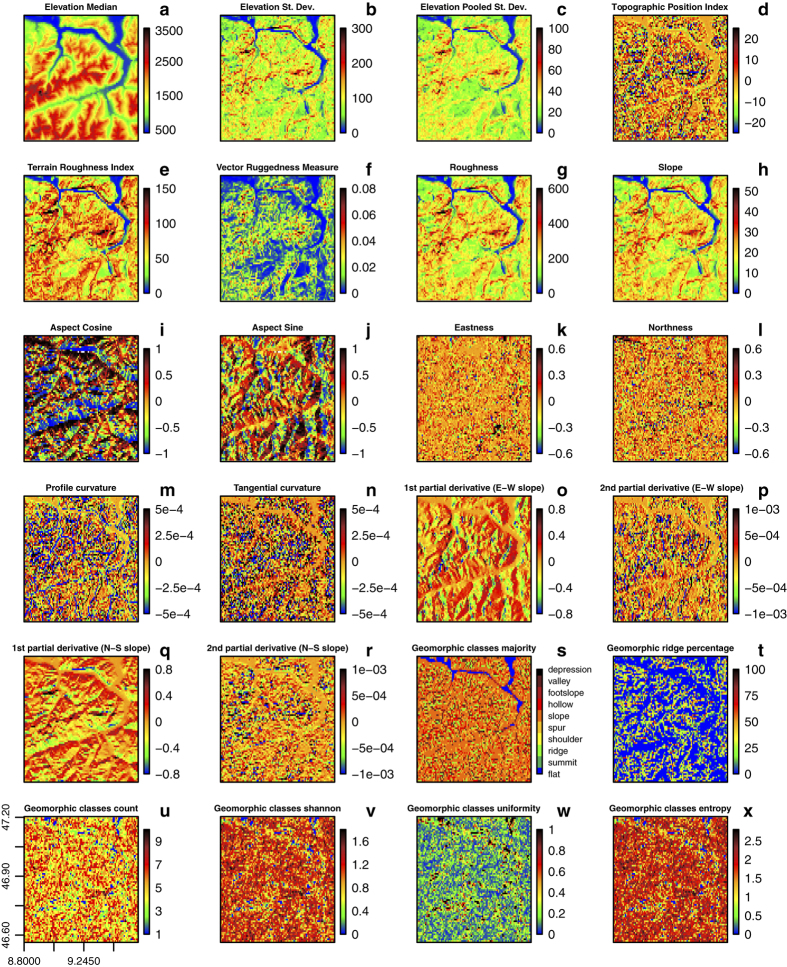
Figure 5. A subset of the derived topographic variables using the 250 m GMTED source layer that have been aggregated to 1 km spatial grain (4×4 cells).
The geographic extent (76×72 km) refers to the Alps regions close to Liechtenstein, i.e., the box in Figure 4c. The continuous variables (from ‘a’ to ‘r’) were aggregated using the median value. The categorical variables (Figure 5s-w) were aggregated using six metrics: percent cover of each class (in this case percent of ridge), number of classes, the majority class, Shannon index, entropy and uniformity.

