
Figure 8. Correlation matrix plot (11×11 variables) for the GMTED derived topographic variables (aggregated at 1 km spatial grains), describing the relief shape in terms of slope, aspect and curvatures in the Alps region depicted in Figure 2b (2400×1600 cells).
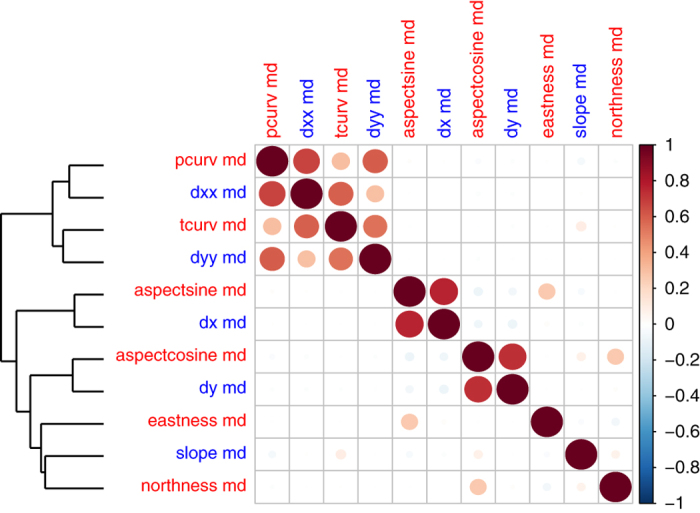
Variable name and aggregation approach abbreviation are reported in Table 1. The scale bar reports Pearson's positive (red) and negative (blue) correlation coefficients. Circles in the plots have different sizes according to the absolute values of correlation coefficients. The GMTED derived topographic variables are labeled in red and blue to better distinguish the column and row of the plot and are ordered according to a hierarchical clustering on the values obtained from 200,000 1 km pixels randomly selected from the Alps region.