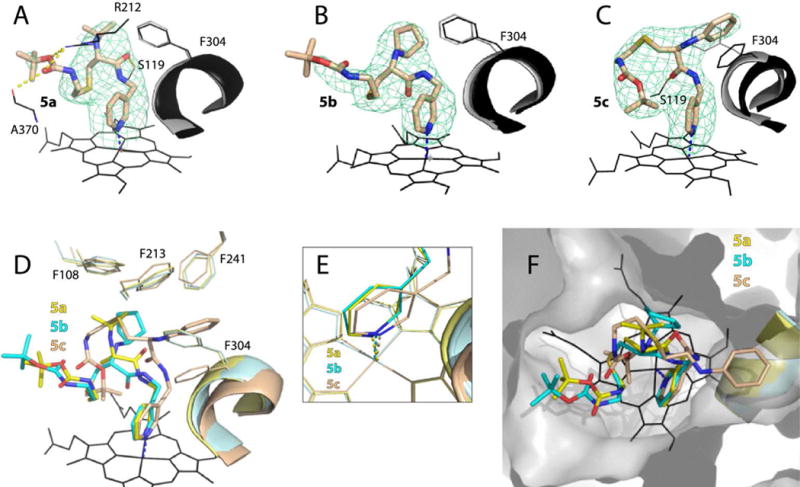
Figure 5.

Crystal structures of CYP3A4 bound to the 5a–c analogs. A–C, The binding mode of 5a, 5b and 5c, respectively. The Phe304-containing portions of the I-helix in the inhibitor-bound and ligand-free (5VCC) structures of CYP3A4 are displayed in black and gray, respectively. Polder omit maps contoured at 4σ level are shown as green mesh; yellow dashed lines are hydrogen bonds. D–F, Structural overlays showing the extent of the I-helix displacement, position of the heme-ligating pyridine, and the ligands’ orientation in the active site cavity (top view), respectively.
