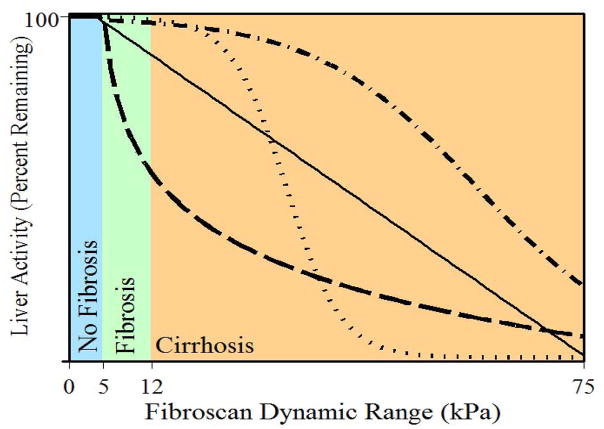
Figure 2. Vibration-controlled transient elastography (VCTE) as a possible methodology to assess changes in liver drug metabolism.
The figure illustrates the hypothesized inverse relationship between liver activity (Y-axis), as would be measured for example by hepatic drug metabolism, and liver stiffness (X-axis), as would be measured by VCTE. The lines depict the hypothesized potential nature of the relationship, i.e. sigmoidal, linear, exponential, etc. Liver stiffness as determined by Fibroscan is measured in kilopascals (kPa).

