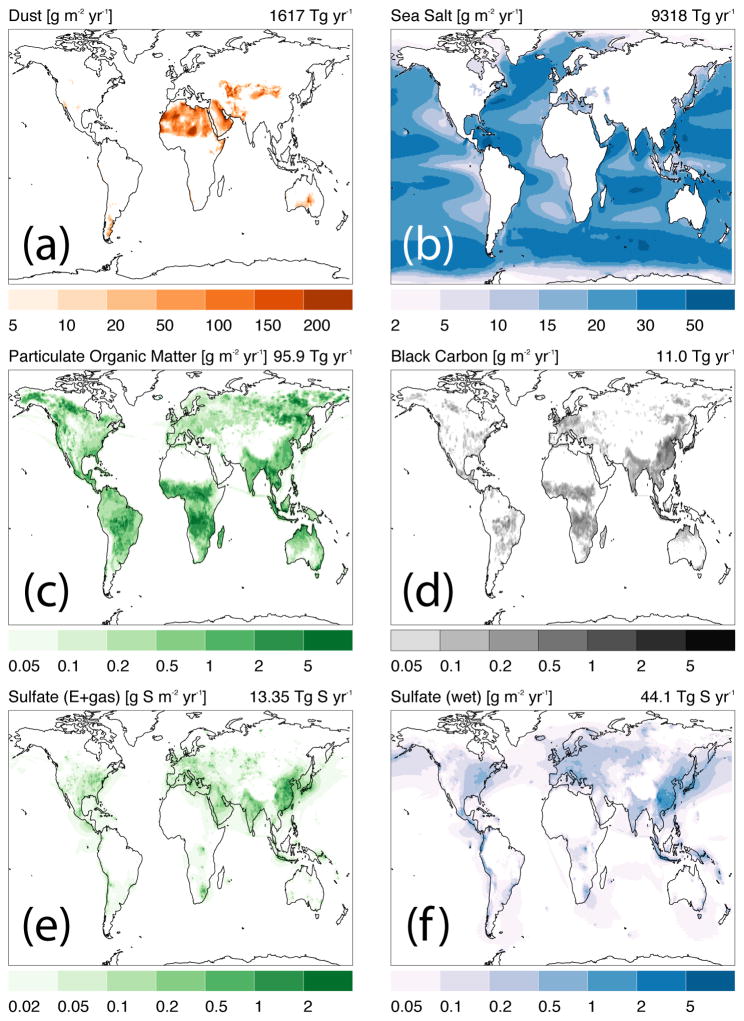
Fig. 1.
Annual-mean aerosol emissions climatology (2000 – 2014) from MERRA-2. Emissions are shown for (a) dust, (b) sea salt, (c) particulate organic matter (POM), (d) black carbon (BC), (e) primary sulfate (SO4) and sulfate from oxidation of sulfur dioxide gas (SO2), and (f) SO4 from aqueous production. We define POM = 1.4 × OC, where OC is organic carbon (Textor et al. 2006). Emissions are from all sectors (fossil fuel, biofuel, biomass burning, and biogenic, if applicable). The global, annual mean emissions are given on each panel.

