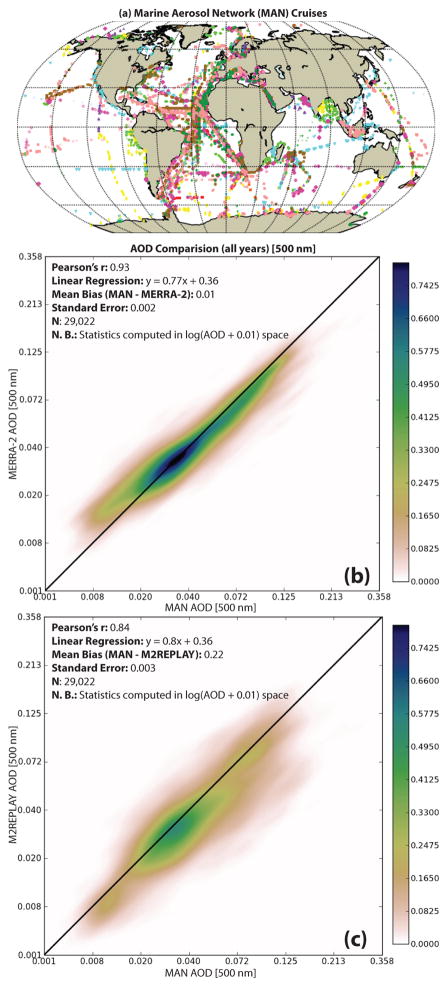
Fig. 10.
(a) Maritime Aerosol Network (MAN) cruises 2004 – 2015, color coded by year (see the MAN website for information on specific cruises). (b) Joint PDF comparison of co-located MAN-observed and MERRA-2 AOD for the same period. (c) Same as (b) but for the M2REPLAY control simulation without AOD assimilation. Note that statistics are calculated in natural log-transformed AOD space, the colorbar represents probability density, and the x- and y-axes have been re-labeled in linear AOD space for clarity.

