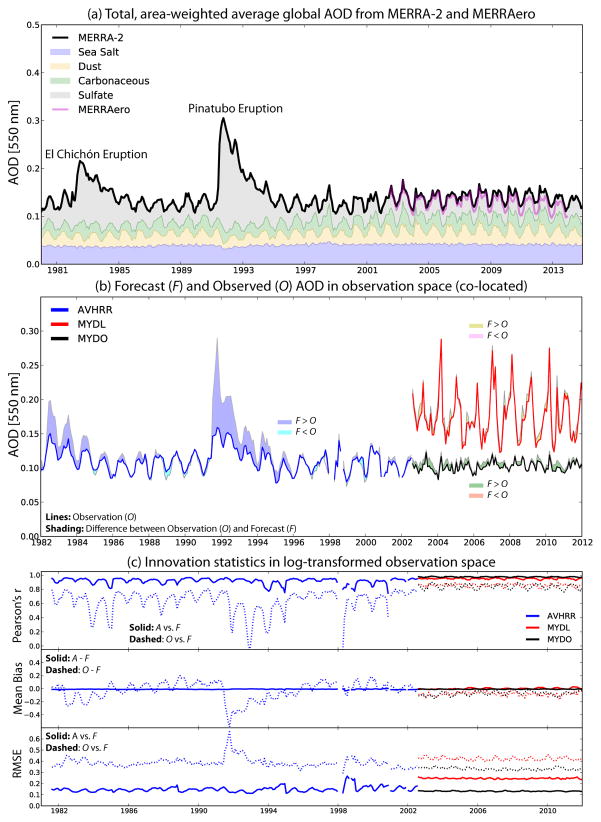
Fig. 5.
(a) Global, area-weighted average monthly-mean 550 nm AOD from MERRA-2 (black line) and MERRAero (magenta) and contributions from various aerosol species (shading, MERRA-2 only). Carbonaceous aerosol AOD (green) is the sum of organic plus black carbon AOD. Note that only the total AOD (thick black line) is directly constrained by the aerosol assimilation; aerosol speciation depends strongly on emission and loss processes in the model. (b) Monthly-mean, co-located in time and space (pair-wise in observation space) comparison of the 3-hour model forecast (F) and observations (O) for AVHRR NNR, MODIS Aqua land NNR (MYDL), and MODIS Aqua ocean NNR (MYDO). Here the lines represent the observed AOD, and shading indicates the difference between F and O. (c) Monthly-mean statistics computed in log-transformed observation space. Statistics comparing O and F are shown as dashed lines, and relationships between the observations and analysis (A) are shown as solid lines for the same sensors as in (b). Supplementary figures show the statistics for the other sensors in the MERRA-2 aerosol observing system (Table 2). The log-space errors (standard deviation) in AOD are related to linear errors according to Eq. 7. Note that we expect the monthly mean statistics presented here to outperform statistics sampled at higher time frequencies.

