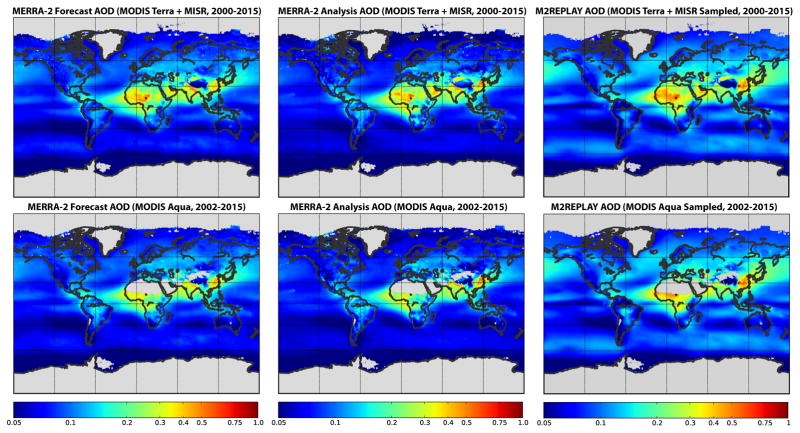
Fig. 6.
Climatological annual-mean 3-hr forecast (left column), analysis (center column), and control run (M2REPLAY; right column) AOD for MODIS Terra plus MISR over bright surfaces (top row) and MODIS Aqua (bottom row). Grey regions indicate no data, and the control run has been sampled with the day-time orbit of the relevant sensors. Differences between the left and center columns indicate where the the analysis differs from the forecast; in most places, the analysis AOD strongly resembles the forecast. Differences between the center and right column indicate the overall impact of the analysis on simulated AOD since we compare to a control simulation without AOD assimilation.

