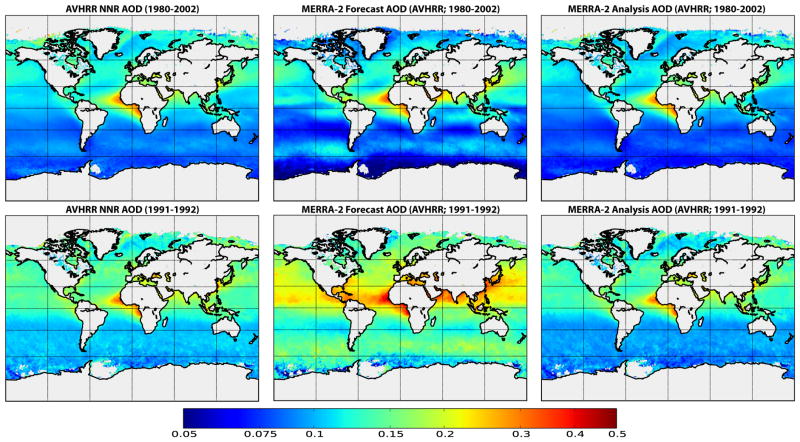
Fig. 7.
Observed (O; left column), forecasted (F; center column) and analyzed (A; right column) AOD in AVHRR observation-space for (top row) 1980 – 2002 and (bottom row) 1991–1992 after the Pinatubo eruption. Grey regions indicate regions with no data. Note that the bias-corrected observations in the left column are from the AVHRR NNR. Forecasted AOD after Pinatubo (bottom row, center column) is generally higher than the observations and analyzed AOD fields, implying negative AOD increments during this time period. We also note possible cloud contamination in the high latitude observations from AVHRR which may impact the analysis.

