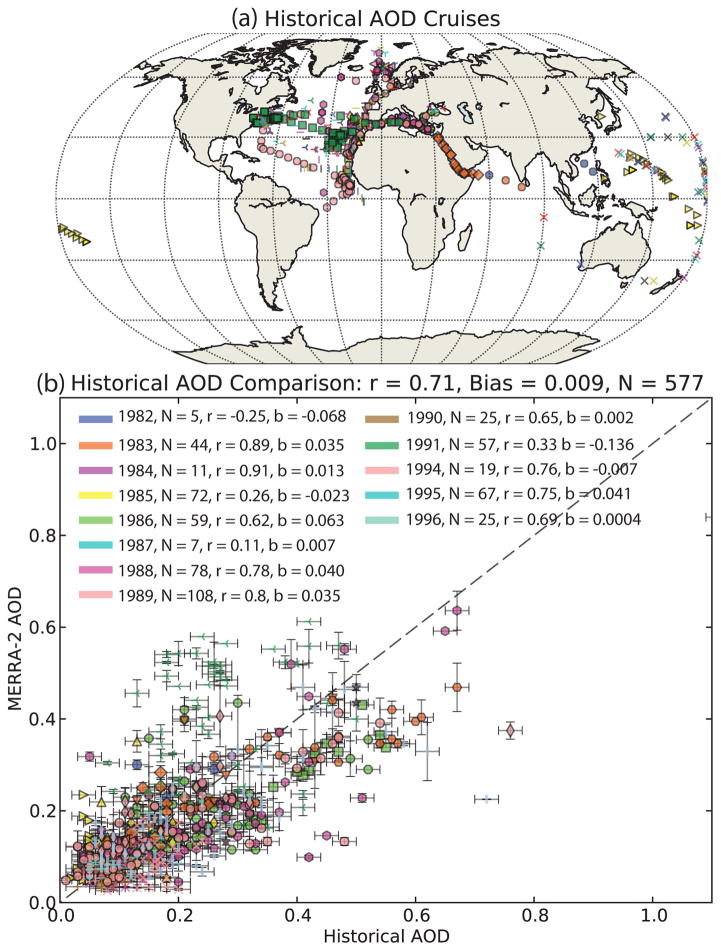
Fig. 9.
Comparison of MERRA-2 and historical shipborne AOD observations. (a) Map showing the location of the ship cruises spanning the period 1982 –1996. (b) Scatter plot of AOD spanning various years (indicated by different colors) and different cruises (indicated by marker shape). X-axis error bars represent the assumed observed AOD error of 0.02, and y-axis error bars are the standard deviation of the MERRA-2 AOD used to make the morning or afternoon averages (see text for sampling strategy).

