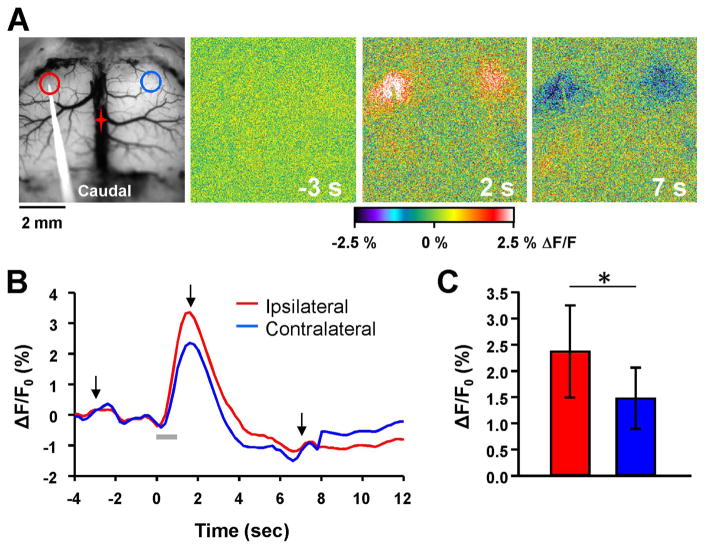
Fig. 1.
Flavoprotein autofluorescence responses to intracortical stimulation. A. Example background and pseudocolored images of the motor cortex in an FVB mouse during a 10 Hz train stimulation for 1 s. Red and blue circles denote regions of interest (ROIs) for calculating peak autofluorescence changes on the ipsilateral and contralateral hemispheres, respectively. In this and all subsequent figures, the red star indicates the location of bregma. B. Time course of the flavoprotein autofluorescence change in response to the 10 Hz stimulation (gray bar). Arrows denote times at which images from A were taken. C. Quantification of the peak flavoprotein autofluorescence response on the ipsilateral (red) and contralateral (blue) hemisphere (n=15).

