Fig. 2.
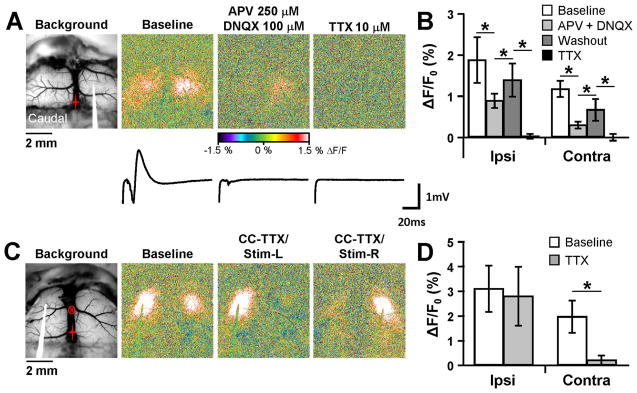
Involvement of ionotropic glutamate receptors and the corpus callosum. A. Background and pseudocolored responses to 10 Hz stimulation under baseline conditions (left), or in the presence of either 250 μM APV/100 μM DNQX (middle) or 10 μM TTX (right). Traces below each image correspond to local field potentials in the contralateral hemisphere for the three different conditions. The end of the stimulus artifact is shown at the beginning of each field potential trace. B. Mean peak flavoprotein response from all conditions tested for the ipsilateral and contralateral hemispheres (n=4). C. Flavoprotein response in the same animal before and after TTX microinjection (circled x) into the corpus callosum. Blocking the corpus callosum (CC-TTX) caused a near complete loss of the contralateral response (middle). Moving the stimulating electrode to the other hemisphere in the same animal (right) still resulted in a similar ipsilateral response, but failed to show a contralateral response. D. Population (n=4) showing abolishment of the contralateral response following TTX blockade of the corpus callosum.

