Fig. 3.
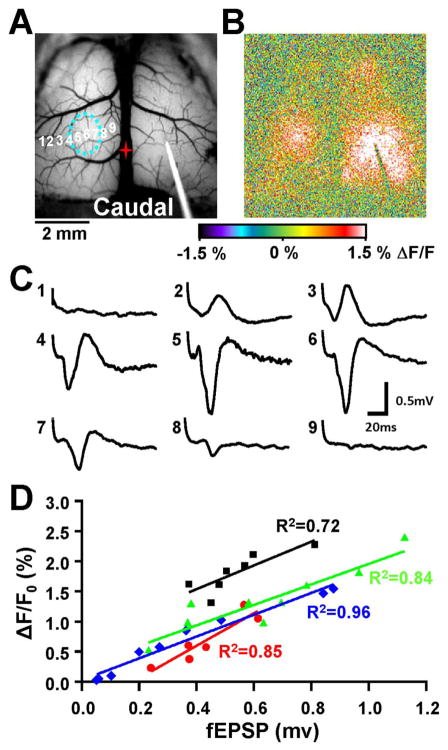
Local field potentials correlate with the contralateral flavoprotein response. A. Brightfield image showing placement of the stimulating electrode on the right hemisphere, with several different recording locations (numbered 1–9) on the left hemisphere. The dashed blue circle corresponds to the area of maximal fluorescence increase determined following stimulation. B. Pseudocolored flavoprotein image during the maximal contralateral response. C. Local field potentials at the different recording sites shown in A following stimulation. The LFP response increases towards the center of the maximal flavoprotein response (sites 4–6) and decreases farther out on each side. D. Population (n=4, black, green, blue, and red) showing a strong linear relationship between the amplitude of the contralateral flavoprotein response and the amplitude of the LFP response. LFP traces from C corresponds to the blue trace.

