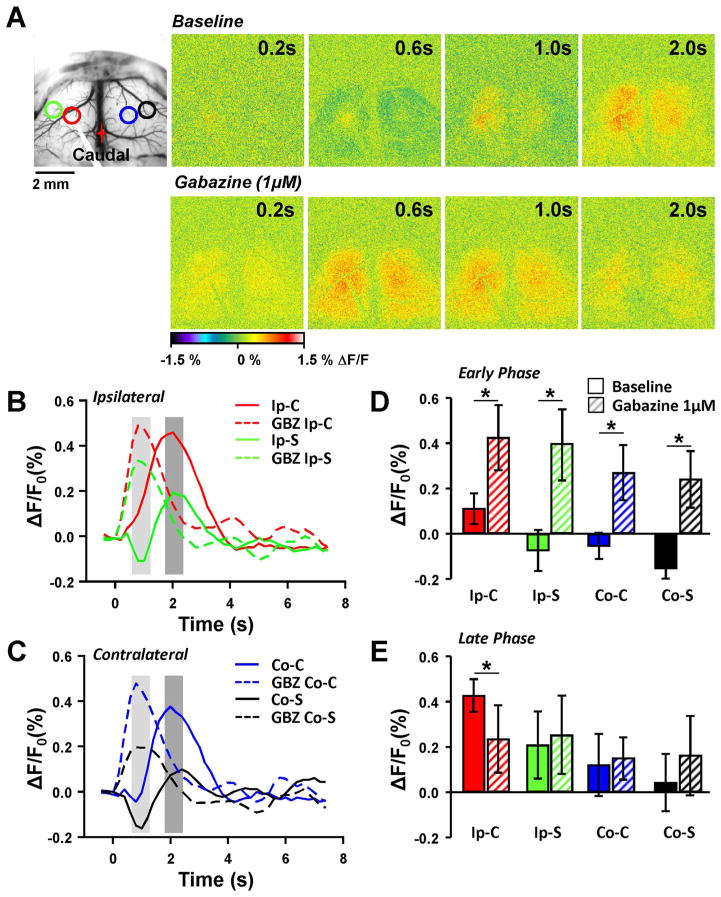
Fig. 4.
Inhibitory response following single pulse stimulation. A. Brightfield image showing placement of stimulating electrode and locations of four different ROIs: Ipsilateral center (Ip-C, red); Ipsilateral surround (Ip-S, green); Contralateral center (Co-C, blue); Contralateral surround (Co-S, black). Pseudocolored flavoprotein response following single pulse stimulation under baseline conditions (top row) and following application of 1 μM Gabazine (GBZ) in the same animal. B. Example flavoprotein traces from the ipsilateral hemisphere following single pulse stimulation in baseline (solid lines) and following GBZ application (dashed lines). The light and dark gray regions indicate two phases of the response that were quantified further, the early and late phase, respectively. C. Same as in B except that the responses were collected from the contralateral hemisphere. D. Population data (n=4) from the early phase (light gray regions in B and C) from baseline (solid bars) and GBZ treatment (striped bars) from the different ROIs. E. Same as D except population data from the late phase.

