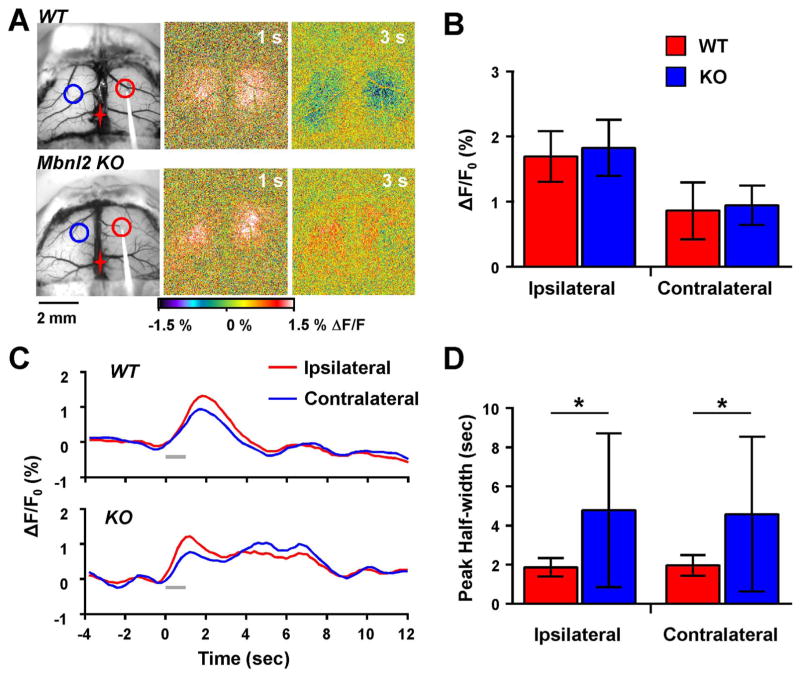
Fig. 5.
Prolonged flavoprotein response in Mbnl2 KO mice. A. Example images from a WT and an Mbnl2 KO mouse following 10 Hz stimulation. A prolonged increase in flavoprotein signal was observed in the Mbnl2 KO mouse. Red and blue circles represent ROIs for the ipsilateral and contralateral hemispheres, respectively. B. Quantification of the peak flavoprotein response revealed no significant difference between WT (n=7) and MBNL2 KO mice (n=8). C. Example flavoprotein traces from a WT and Mbnl2 KO mouse highlight the prolonged increase in the time course of the flavoprotein response in the Mbnl2 KO. D. Mean changes in the duration of the flavoprotein response measured by the peak half-width show a significant increase in the flavoprotein duration in Mbnl2 KO mice.

