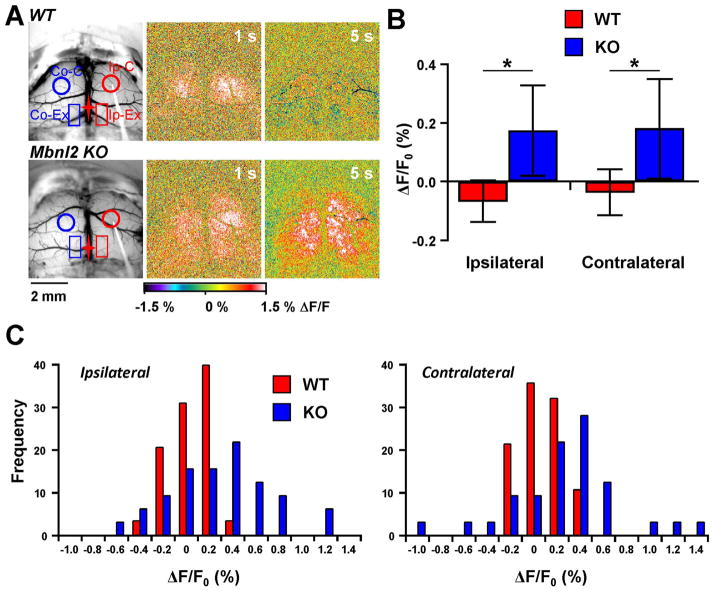
Fig. 6.
Additional regions activated in Mbnl2 KO mice following 10 Hz stimulation. A. Example images from WT and Mbnl2 KO mice showing the placement of two new rectangular ROIs: Ip-Ex, ipsilateral extra region; and Co-Ex, contralateral extra region. Pseudocolored images show the larger flavoprotein response area in the Mbnl2 KO mouse at 5 s compared to the WT mouse. B. Average peak flavoprotein increase in the extra regions show significant increases compared to WT mice (WT=7, KO=8). C. Distributions of the peak flavoprotein response from the extra regions in the ipsilateral and contralateral hemispheres.

