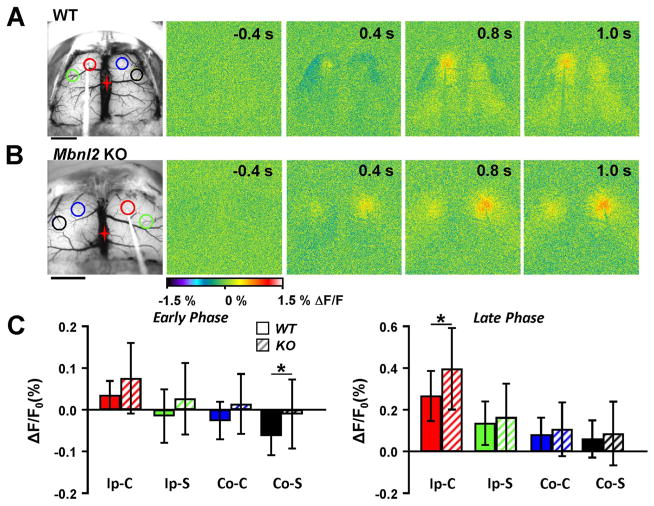
Fig. 7.
Reduced inhibitory-like surround in Mbnl2 KO mice following single pulse stimulation. A. Example images from a WT mouse following single pulse stimulation, and location of the ROIs. Scale bar =2 mm. B. Flavoprotein responses from an example Mbnl2 KO mouse following single pulse stimulation. Scale bar=2 mm. C. Average data of the peak flavoprotein response during the early and late phase (see Fig. 4) in WT (n=7, solid bars) and Mbnl2 KO mice (n=8, striped bars).

