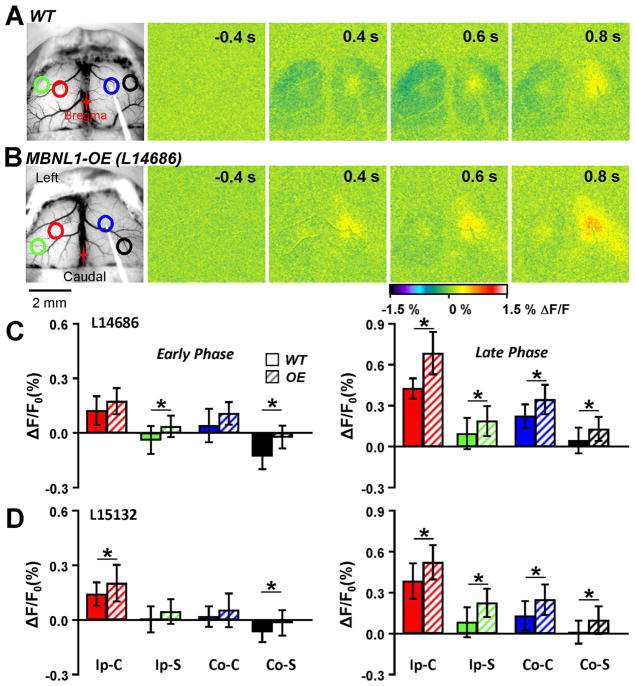
Fig. 9.
Impairment of inhibitory activity following single pulse stimulation in MBNL1-OE mice. A. Example images from a WT mouse following single pulse stimulation. Similar results were observed to that in Fig. 4, with a region of decreased flavoprotein fluorescence surrounding a local increase. B. Responses from an example MBNL1-OE mouse following single pulse stimulation revealed a near lack of flavoprotein decrease in the ipsilateral and contralateral surrounding areas. C. Quantification of the peak flavoprotein response in L14686 (WT=6, OE=5) from the four different ROIs in the early (left) and late (right) phase described in Fig. 4. D. Same as C except for L15132 (WT=7, OE=7). Both lines showed a larger fluorescence response in the surrounding ROIs compared to the WT mice.

