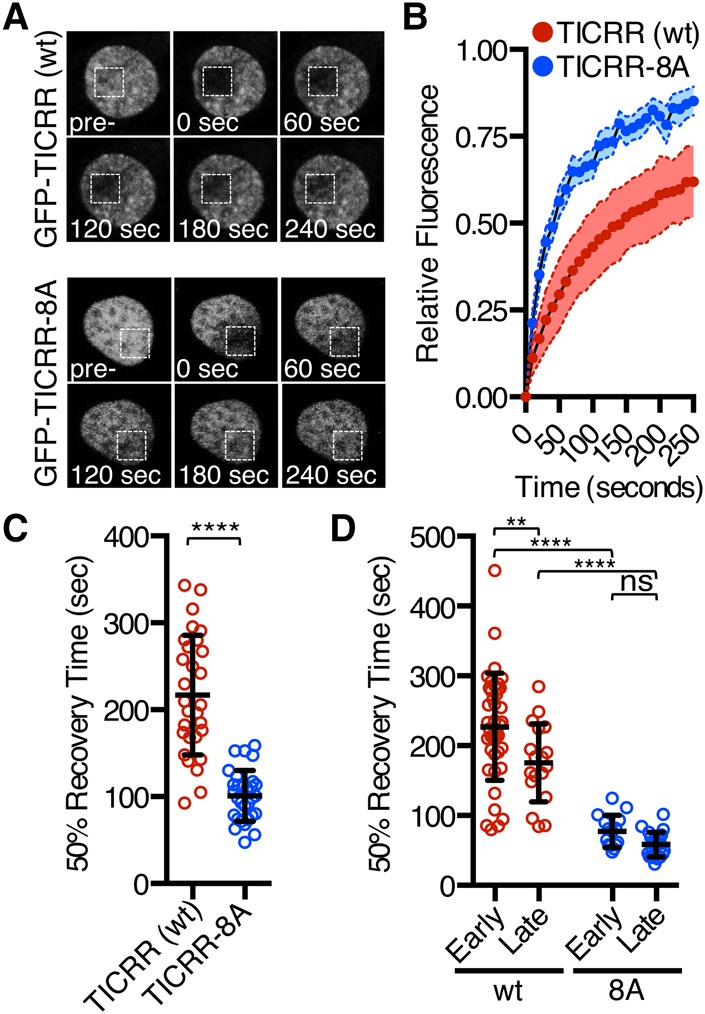
Figure 3.

BET proteins recruit TICRR to chromatin. (A) Representative nuclei of cells expressing EGFP-tagged TICRR or TICRR-8A. The square marks the area photobleached. Images were taken at the indicated times after photobleaching. (B) Relative fluorescence in the bleached region for replicate FRAP experiments in which images were taken every 10 sec. (C) Times to 50% fluorescence recovery for experiments shown in B. Fifty percent recovery times were calculated from fitted curves. Mean ± SD. (****) P < 0.0001. (D) Times to 50% recovery for FRAP of synchronized cells in early or late S phase. Mean ± SD. (**) P = 0.0042; (****) P < 0.0001.
