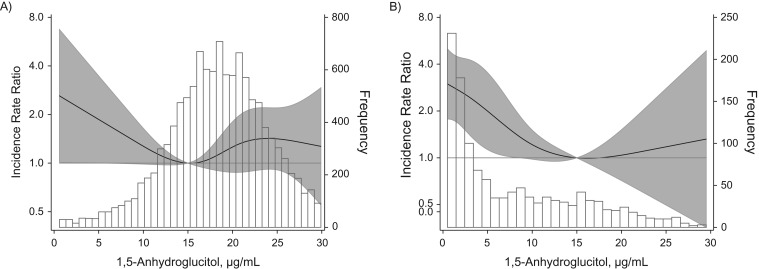
Figure 1.
Distribution of 1,5-anhydroglucitol (1,5-AG) and adjusted incidence rate ratios (IRRs) for end-stage renal disease according to serum levels of 1,5-AG among study participants without diagnosed diabetes (A) and with diagnosed diabetes (B), Atherosclerosis Risk in Communities Study, United States, 1990–2013. The solid black line represents IRR for end-stage renal disease according to serum level of 1,5-AG, modeled as restricted cubic spline terms with knots at the 5th, 35th, 65th, and 95th percentiles. The white bars with black outline depict the histogram for the distribution of 1,5-AG. IRRs were adjusted for age, sex, race, and estimated glomerular filtration rate (creatinine-cystatin C), modeled as linear spline terms with knots at 60 mL/min/1.73 m2 and 90 mL/min/1.73 m2. The shaded area around the solid black line represents 95% confidence intervals.

