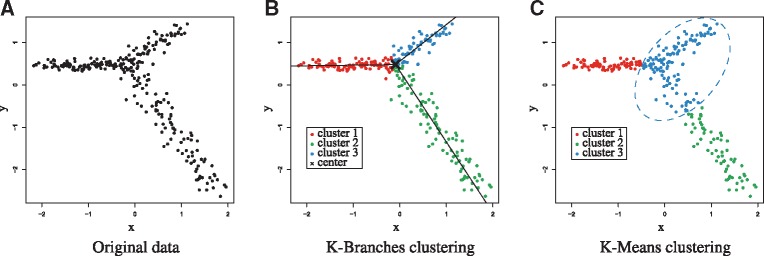
Fig. 2.
Illustration of K-Branches clustering on artificial data and comparison to K-Means. (A) Original data (B) In the case artificial data, K-Branches successfully clusters the three halflines. The center of the halflines as well as the lines corresponding to the direction of each cluster are plotted on top of the data points. The medoids version yields almost identical results for the same data. (C) Unlike K-Branches, K-Means (also with K = 3) merges part of the bottom halfline into the middle cluster. Since K-Means clusters points in spherical clusters, it is clearly not suitable for clustering data points which belong to distinct differentiation trajectories

