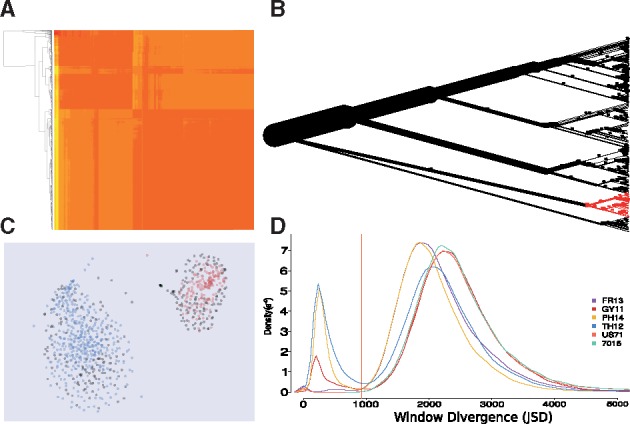
Fig. 1.

Visualization and interactive exploration of assemblies. (A) Pairwise compositional divergence of contigs produced by PhylOligo. Contigs are reordered by hierarchical clustering. (B) Contig tree produced by PhylOligo on the tardigrade genome. The clade in red is the current selection pointed by the user. (C) Contigs clustered by HDBSCAN on oligonucleotide frequencies, Data from Magnaporthe oryzae. Red and blue are predicted clusters, grey are unclassified. The hyperspace is reduced to 2 dimensions with t-SNE. (D) Determination of the untargeted threshold in ContaLocate based on the distribution of distances between the untargeted clade and the scanning windows over the whole assembly (Color version of this figure is available at Bioinformatics online.)
