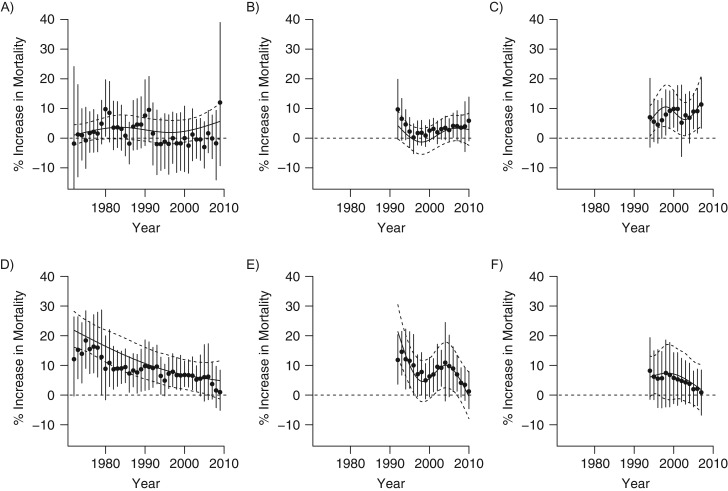
Figure 1.
Country-specific temporal changes in cold- and heat-related mortality risks (1972–2009 for Japan, 1992–2010 for Korea, and 1994–2007 for Taiwan). Cold-related risk for Japan (A), Korea (B), and Taiwan (C). Heat-related risk for Japan (D), Korea (E), and Taiwan (F). Circles represent the central estimates of risk with vertical lines as the 95% posterior intervals obtained from the time-constant models using subsets of data (5-year subsets with results presented at the corresponding midpoint year and 3- and 4-year subsets for the earliest and latest 2-year periods, due to data availability). The solid and dashed horizontal lines represent the central estimates of risk with 95% posterior intervals obtained from the nonlinear time-varying models using the whole data set.

