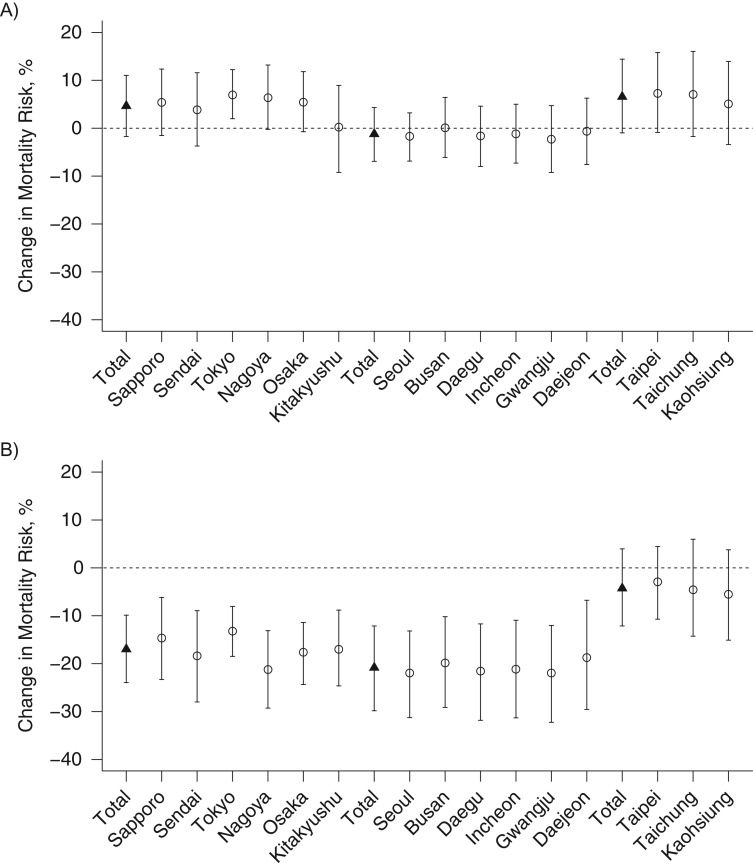
Figure 2.
City-specific and country-specific changes in cold- and heat-related mortality risk, comparing risks at the first and last years of the study period in each country (1972–2009 for Japan, 1992–2010 for Korea, and 1994–2007 for Taiwan). A) Changes in cold-related mortality risk. B) Changes in heat-related mortality risk. Circles and triangles represent city-specific and country-specific central estimates of risk change with bars indicating 95% posterior intervals.

