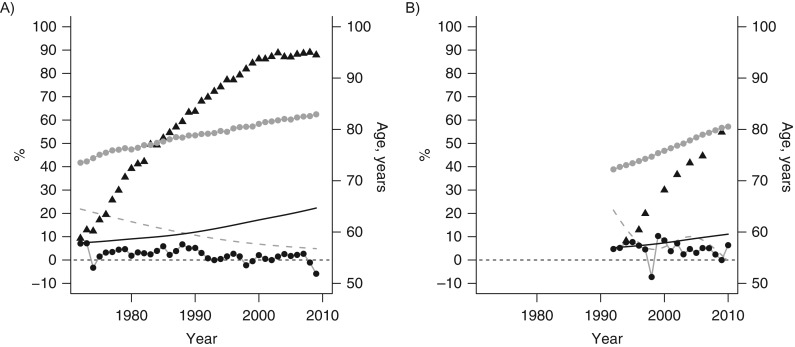
Figure 3.
Factors that may covary with the temporal trend in heat-related mortality risks in Japan (1972–2009) (A) and Korea (1992–2010) (B). Dashed line: estimated heat-related risk (% increase in mortality); triangle: air conditioning prevalence rate (%); black circle: Gross National Product growth rate (%); solid line: older population (% ≥65 years); and grey circle: life expectancy (years).

