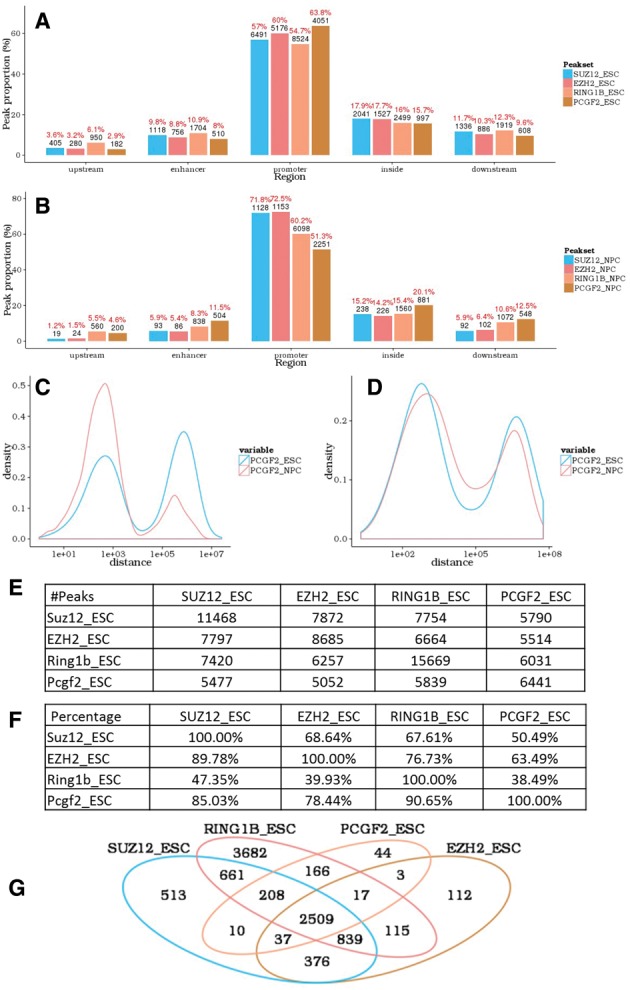
Fig. 1.

annoPeak results for example ChIP-seq datasets (NCBI GEO with series ID GSE74330). (A,B) Peak-associated gene structure; distribution of SUZ12, EZH2, RING1B and PCGF2 binding to gene structures in mES (A) and NPC (B). (C,D) Peak to nearest peak distance; distribution plots comparing binding profiles of PCGF2 from mES to NPC in promoter regions (C) and enhancer regions (D). (E,F) Tables with the number (E) and percentage (F) of overlapping peaks between the four proteins in mES; setting a maximum allowed distance between peaks of 1 kb. (G). Venn diagram depicting overlapping peak-associated gene targets for the four proteins in mES
